Spectroscopy and Reflectance
Introduction
Understanding and modeling spectroscopy concepts was a big part of my PhD work. One of the subdomains I was interested in was surface reflectivity. A lot of instruments collect their photons after they bounce off a surface. Different materials absorb/reflect photons in different ways and it can skew data retrievals if you don’t know what the reflecting surface is made of. For instance, if energy is missing at a measured wavelength, is it because it’s been absorbed by the atmosphere or is it because it bounced off concrete?
Alternatively, if you know everything about your group of photons except for the reflecting material they bounced off, then spectroscopy can measure the return signal across wavelength bins and determine the material. You can also understand how different materials can trick your instrument into reporting false positives. This topic is what I investigated when I wrote a peer-reviewed paper called “Analysis of the impact of wavelength separation on reflectivity error for differential absorption lidar using the ASTER spectral library”.
DIAL Overview
A differential absorption lidar (DIAL) measures two similar laser pulses before sending them out to interact with the world. When the pulses bounce back, missing energy can mean the atmosphere absorbed it, the surface absorbed it, photons got scattered by dust, or any one of dozens of other things. Scientists get around solving for most of these things by taking the ratio of the two pulses. The equation looks like:
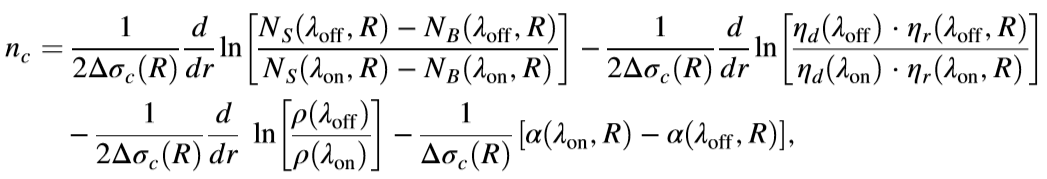
There’s a lot going on there, but the variable that matters most is lambda, λ, which is the wavelength of the laser. Everything this equation captures (e.g. reflectivity and optical efficiency) depends on the wavelength. For example, optical glass refracts light at different angles depending on wavelength which affects efficiency.
In a DIAL instrument, one laser is tuned “off” and one is tuned “on”. For Ball’s Methane Monitor, “on” means the laser is strongly absorbed by methane and “off” means methane absorbs very little of the laser. If everything else is equal along the path, then the only difference should be how much of the “on” signal is absorbed by methane.
The problem is that so many things change with wavelength that solving all these terms can get messy fast. Instrument designers get around this by making the two wavelengths so close to each other that the results each wavelength are mostly the same, so the ratios are equal to one. (e.g. the optical efficiency is the same if the wavelengths are basically the same.) In the equation above, you can see there are natural log functions around these ratios. Since the natural log of one is zero, that means all those terms drop out and the equation simplifies to:
The “N” variable is the number of signal photons you measure. So all you have to do (in theory) is take the ratios of the number of photons you count, plug in some numbers, and solve for the density of methane along the path.
Work Overview
But what if you can’t get your wavelengths that close together? Or you don’t want to because you want, for instance, three laser pulses so you can measure two gases at once? Or what if the reflecting surface happens to be changing rapidly as a function of wavelength? These types of questions were the subject of my paper.
Analyzing the third term in the equation is what I specifically dove deeper into:

This term is taking the ratio of rho, ρ, which is the reflectivity of the surface the laser bounces off. How much the surface reflects the laser depends on the wavelength of the laser.
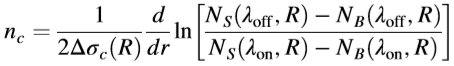
The next image shows how reflectance changes with wavelength for Marble. It bounces back almost 90% of light at 800 nm and much less light around 1,800 nm. (Incidentally, most Marble is white, and you can see that its highest reflectivity spans the human vision range.) The red parts of the curve are showing that reflectivity can be the same value at different wavelengths. If you want the ratio of reflectivity for both wavelengths to equal one (so the natural log is zero and the term disappears), your two lasers must be equally reflected. In this example, if the “on” laser was tuned to 1,200 nm, the “off” laser could be tuned to all sorts of wavelengths in the red region and the reflectivity term would collapse to zero.
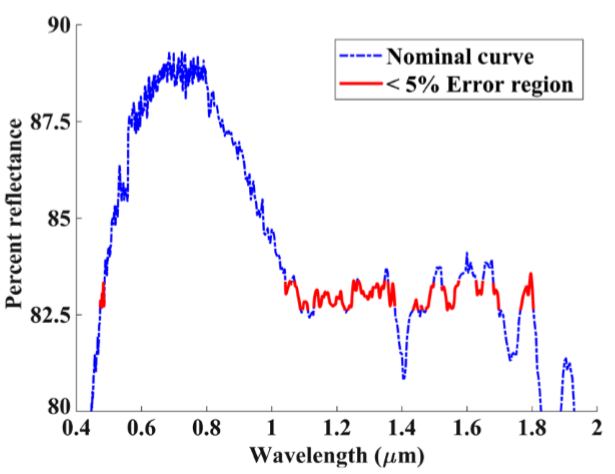
What I did was to study what different materials did to different values of “off” and “on” laser wavelengths. I did this by choosing an online wavelength and then sweeping through all possible offline wavelengths for a given material, calculating the error. The material properties came from the ASTER spectral library. ASTER is the “Advanced Spaceborne Thermal Emission and Reflection Radiometer” on the Terra satellite. Among many great things, the team compiled a database of reflectivity vs. wavelength for thousands of materials. The table below lists the types and quantities of materials I analyzed.
An example plot of results is given below. The x-axis is all the on-line wavelength options. The y-axis is how many nanometers of separation the off-line can be before there is more than 5% error due to reflectivity variation. Each colored line represents how many materials in the database create less than 5% error at that off-line separation. In other words, the red line says that 99% of all materials will produce 5% or less reflectivity error if the off-line’s separation is lower than the red line.
For example, let’s choose an x-axis value of 1.2 um and the 99% threshold. The y-axis value is about 0.5 nm. This means that the off-line’s wavelength must be within 0.5 nm if we want high certainty that the error introduced by reflectivity variation is negligible.
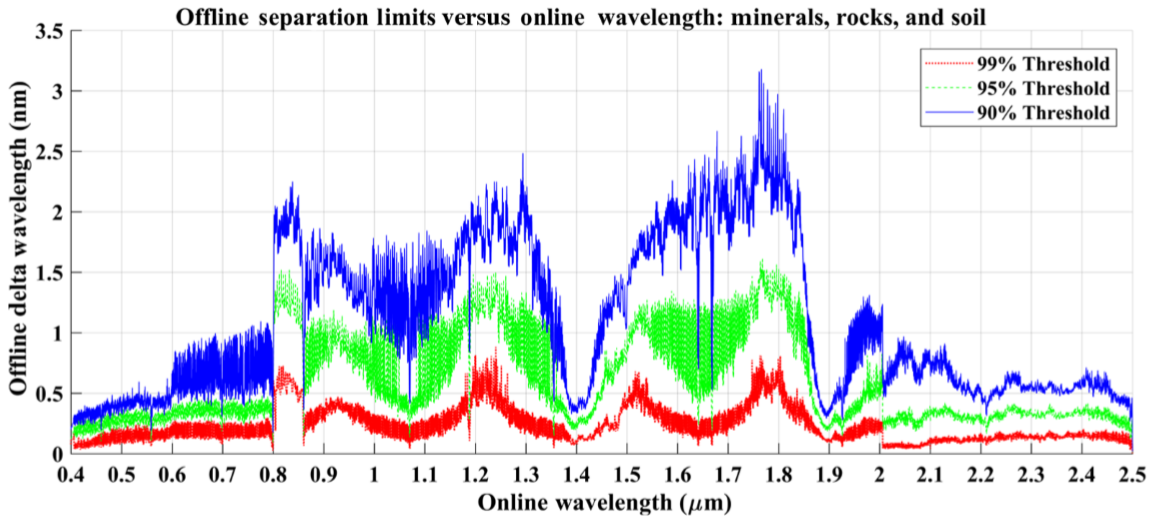
Another example is on-line wavelength around 1.75 um. If you’re willing to accept that 10% of the materials you fly over will produce 5% error, you can have 3nm of separation. This is a huge allowance in the world of lasers and could enable to intriguing dual-gas systems.
The above plot only considers the nominal cases where you keep the off-line close for optical and myriad other reasons. If you want to consider only reflectivity variations, you can extend the analysis out. The marble plot above showed that lots of separation was possible, for example.
The figure below runs this analysis out across the full spectrum for all the materials. Yellow means that 100% of the materials produce 5% or less error due to reflectivity differences, while dark blue means 0% of the materials are acceptable. I found the texture and pattern fascinating. Also interesting is that every combination always has at least one material in the database that would support low reflectivity error. In other words, no grid cell ever has 0 as its value.

Here’s a contour plot of the same thing with zoom-ins to show the way different materials reflect photons.
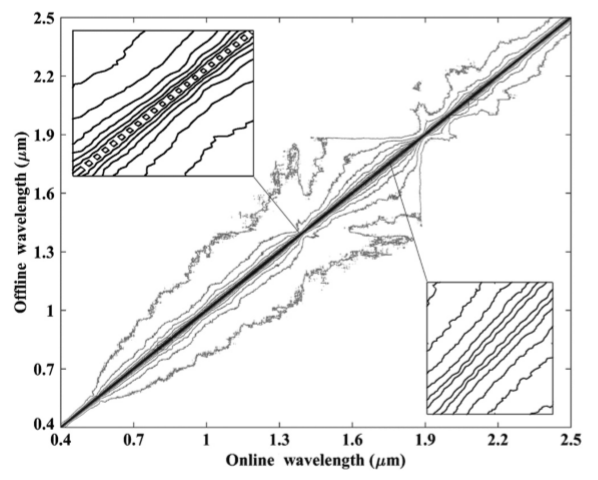
I found this incredibly fascinating. It feels like there are layers of information to be mined from the shapes and textures of this map.
Anyway, you can use the approach above to find good wavelengths to build an instrument around. The plot below looks at methane absorption features at three wavelengths. The vertical lines represent what percentage of the materials in the database would give low reflectivity error if you choose an offline wavelength within the band.
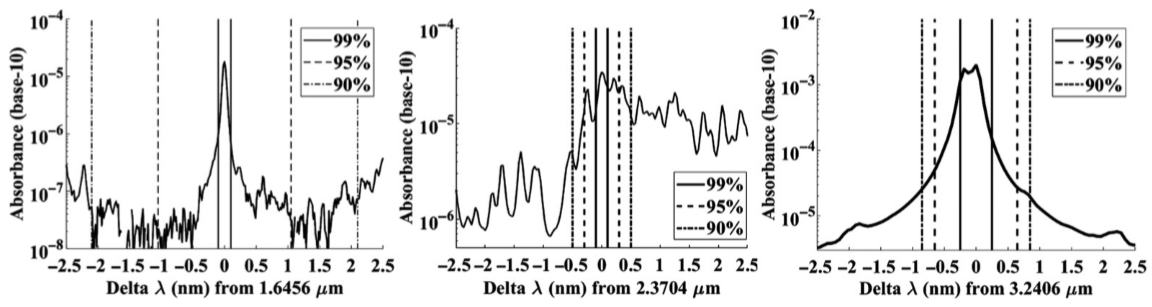
For example, the left-most plot is a methane feature at about 1,645.6 nm. The 99% threshold is just 0.1 nm from the peak, which means an optimal laser tuning (for reflectivity purposes) would be within 0.1 nm. The 95% threshold is about 1 nm away. Ball’s Methane Monitor has about 0.2 nm of on to off-line separation, which means that a few percent of the materials it flies over will create at least 5% error in the retrieval values.
If we look at the middle plot, the reflectivity bands are very close to the on-line feature. It would be difficult to build a system around this wavelength.
I could go on and on about this stuff. There are many other factors to consider as well, such as beam width and the fact that the ground is rarely a single type of material. If you’re interested in learning more, I’ll point you to the paper or you can ping me.
Publications
A copy of the paper is here: Reflectance Paper
Final Thoughts
Spectroscopy is the current and future powerhouse of remote sensing. I suspect it won’t be long before a real-time, broad spectrum spectrometer is flying around mapping minerals and atmospheres. A big part of polishing a system to that level will be detailed mapping and compensation of reflectivity as a function of wavelength. Once we’ve got the system, though, we can do things like filter plastic from the ocean, pick up trash in the forest, and maybe even filter cancer cells from blood.