Methane Monitor: A laser-based methane quantifying instrument
Introduction
Methane Monitor is a differential absorption laser instrument that uses two lasers with wavelengths tuned very close to each other. The instrument flies at roughly 1,000 meters above the ground, scanning the beams around a 400-meter-wide path looking for methane. The first image illustrates the operational concept. The methane seen in the image is from real data taken with the system.

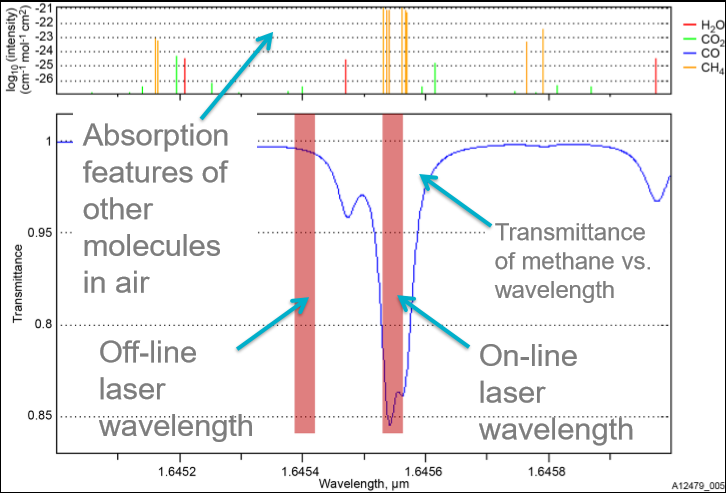
The instrument works by sending out two laser pulses. One is tuned “on line” onto a methane absorption feature at 1645.55 nm, the other is tuned “off line” the feature at 1645.40 nm. The pulses travel through the atmosphere, bounce off the ground, and are captured by the instrument. The methane along the path absorbs energy from the “on line” laser while the “off line” laser is little absorbed. By calculating the ratio of their energy losses and comparing to results from picked-off energy sent through a calibrated gas cell, we can determine how much methane was along the path. These pulses were sent out thousands of times a second. The next image shows the pressure modified methane feature we used.
The next image shows the hardware. The left-side image is of the optics housing assembly. The laser was sent to it with a fiber optic cable. A pick-off system and gas cell were near the inputs while most of the laser pulse was sent to a steering mirror. The receiver optics are also there as well as the IMU we used to geolocate data. The right side shows the computer and laser rack. Our team is in the upper right, getting ready to fly.

Work Overview
Where to start? There were a handful of us on this program and everyone did everything. I wrote a hundred thousand lines of code, ran mechanical and optical analyses, went deep into everything methane, spent hundreds of hours on a mesa running ground tests, and even more time in small aircraft operating the instrument around the country. I’m exceedingly proud of my work and what the team accomplished.
One of my responsibilities was to convert our GPS, IMU, raw instrument data, and pointing vectors into customer-ready images and files. We generated about a gigabyte of data every 40 seconds so flights would land with hundreds of gigabytes of data. The only way to get through that much data was to write parallelized code for a server cluster. Even with Matlab, we could get through a day’s worth of data in an hour (compared to 18 hours on a standard computer.)
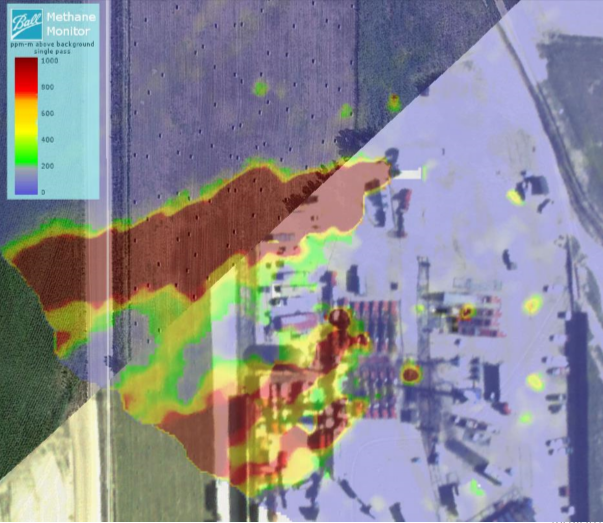
The image below is an example of what I created. It comes from an automatically created Google Earth KML file and shows a large methane plume coming from a leaking storage tank.
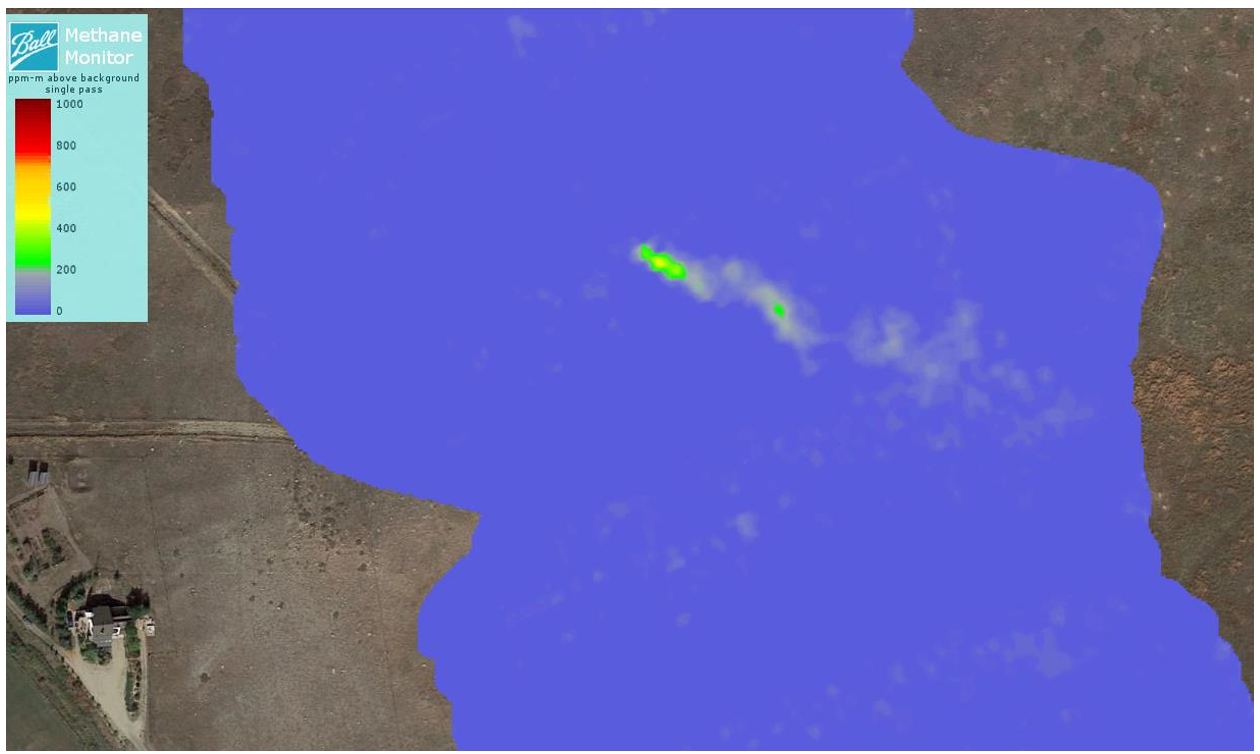
A second large responsibility was serving as the primary instrument operator. I have an Instrument Flight Rules (IFR) pilot’s license, love to fly, and love to operate instruments. It was a perfect role for me. The area I flew over most often was a mesa north of Boulder, CO as we could intentionally release known quantities of methane to test our instrument. The next image is an example of a test flight. A house in the lower left helps scale how large our swath width was and how well it picked up a small, simulated leak.
I flew over basins, pipelines, and facilities. There were campaigns in Texas, New Mexico, Colorado, and all over California. Sometimes I’d go out on my own to these locations, sometimes there would be a small crew of us. Often, I’d be in the field for a full work week and travel to and from the campaign on the weekends. There was one memorable campaign outside of Dallas that required a two-day road trip in a rented van. Another campaign had a base on a private airfield in northern California with an airplane hangered on the owners’ wooded property.
I prepared for campaigns by creating flight plans, talking with the FAA, getting the airplane’s electrical and mechanical interfaces sorted, writing checklists and procedures, getting computers and hard drives ready, training pilots, and all the many things needed to run flights smoothly. This was a for-profit venture on fixed contracts from utilities and the natural gas industry. We ran it like we were entrepreneurs pinching every penny. Safety was everything, followed closely by making money.
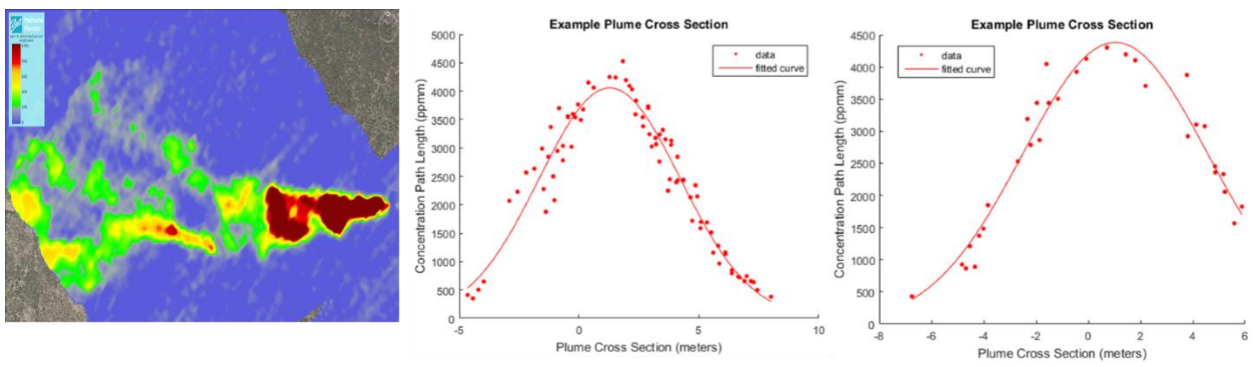
Over time, I developed a deep working knowledge of methane and the industry around it. On the science side, I did work like plume quantification, feature mapping, atmospheric modeling, and laser simulation. This image demonstrates that our sample density was high enough to correctly map a Gaussian plume. The Gaussian plume equation provides the dimensions of a plume given leak rates and wind speeds. It was fun to see data map so well to theory. (The red line is theory and the dots are instrument data from the plume on the left.)
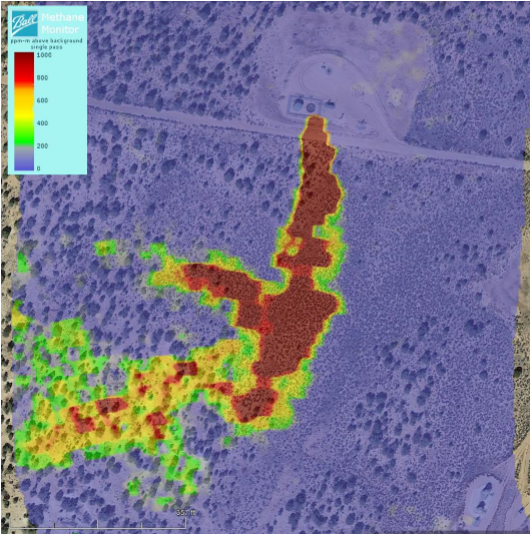
It was also enlightening to fly over industry assets and find large methane plumes. The image below was taken in Colorado. A new gas well was being drilled in what Google showed was a hay field. However, our onboard camera showed that it was a new drilling operation. You can see how much methane was streaming from the site. I flew over thousands of sites and it never ceased to amaze me how frequently we found large plumes.
Publications
Another of my roles was to serve as a science representative. I presented posters and papers at several conferences and networked with industry. I couldn’t get the posters to share with you here. The only paper I could get is the following: Methane Monitor Paper
There is also a pending patent on real-time plume quantification with neural networks. Unfortunately, I can’t go into the details at this time other than to say that it’s another example of the deep dives I took in this project.
Final Thoughts
Methane Monitor remains (to my knowledge) the best instrument in the world at finding and quantifying methane plumes. And it played a critical role in my PhD dissertation as I was funded by the Department of Transportation to try to shrink the instrument to work on an unmanned aerial vehicle. Altogether, I spent about four years of my life developing and operating this instrument. It gave me a deep appreciation for methane and the industry around it.