STORRM: Autonomous ISS Docking
Introduction
I’ve spent eight years (so far) supporting research projects involving machine vision tasks. Most of these have involved navigating to and around the space station, Hubble, satellites, and asteroids. There were some offshoots, though, like landing on the moon, tracking machine gun fire, and quantifying methane plumes. Unfortunately, machine vision is one of those things that companies hate sharing their research on, so I can share few details.
One exception has to do with autonomous approach and docking with the space station using the Sensor Test for Orion RelNav Risk Mitigation (STORRM) system. We could publish a paper based on this work because it was part of an effort to demonstrate expertise as we chased continued funding.
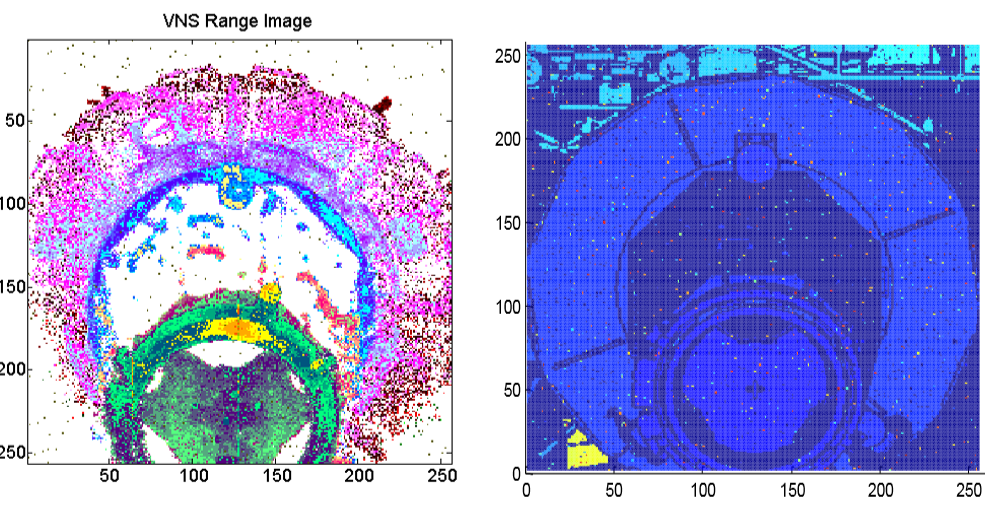
STORRM is a flash lidar system, which means it shoots out a laser pulse and a detector captures the reflected light across its surface. Unlike single pixel detectors, a flash system captures an entire scene where each “pixel” is a range. As an example, the image below shows two images of the docking adapter on the space station taken with a flash lidar system. The left-side image is real point cloud data from STORRM when STS-134 docked with the space station. The right-side image is from a flash lidar simulation software suite I wrote using Matlab and OpenGL. Different colors mean different ranges to the reflective surface.
Work Overview
My job was similar to my other machine vision projects: develop the algorithms that identify and map targets, determine relative pose/orientation for targets, and feed numbers into the guidance, control, and navigation loop. Basically, I was the eyes and image processing center of our brain and someone else was the logic that made decisions on the information. In the image below, I owned “Sensor Model” and “Initializations”, most of “On-board Processor”, and some of “Vehicle Dynamics”.

Having worked a dozen or more projects, I’ve had the opportunity to test many popular approaches. In this paper, we began with Random Sample Consensus (RANSAC). One of the challenges of flash lidar is the huge amounts of data. Even a modest 256x256 array means 65,536 ranges to analyze and they’re streaming at multiple frames per second. We thought there was potential to quickly test samples of points in the image for matches against a database. To its credit, I got it working “okay” in little time. However, it was too slow for real-time operations.
I pivoted to a pyramid of analysis scheme. The idea is to do high level analyses on a full image looking for hints about what’s going on. These hints suggest more detailed analyses to run. Running these new calculations either dismiss the hint or suggest deeper analysis. You stack these layers of deeper analyses until you decide to ignore the information or report success.
As an example, if you imagine you’re looking for your car keys, you don’t scrutinize the ceiling. You first look for broad horizontal surfaces that would support an object, such as a table or the floor. When you find these, you look for something gray and shiny. When you find that, you match your mental model of the shape of keys to what you see. If all those things match, you feel you’ve found your keys. Finding big horizontal surfaces is “easy”, finding “shiny metal” is a little bit more difficult, and matching mental models of your keys is the most difficult. (Imagine if you have several sets of keys and you’re looking for one set. You can see how it gets even more expensive.)
To autonomously dock with the station using only a point cloud (no other systems or sensors were allowed), I thought deeply about what on the space station would represent the lowest levels of analysis. What was the “table” in the keychain analogy? I wanted something fast and settled on pixel counts in a region. This is obvious as if there are few or zero pixels then what are the odds we’re pointing at something as big as the space station? Assuming there were enough pixels to analyze, I looked at something more complex such as eigenvectors built from the cross-product of small areas. Which way were those vectors pointing and how did they compare to their neighbors? Assuming those checks returned positive, I would look at more intricate things. The chain ended with a list of probable orientations. Each frame of ranges was used to build probability lists. Then algorithms could either treat each frame independently or compare changes between frames to determine higher levels of probability. (For instance, it’s not likely a spacecraft is flipping 30 degrees about the yaw axis in a tenth of a second.)
By hammering the features I looked for, I managed to get the algorithms to run faster than the refresh rate of the detector, or essentially real-time. And the results were great!
In the image below, the x and y axes are the orientation of the camera with our target. For example, a -5 on the x-axis and -5 on the y-axis means the camera is tilted by five degrees relative to pitch and yaw from our target. Then the colors represent the single-frame error reported by the algorithm (i.e. no frame-to-frame benefits). The color bar on the right shows the error for each color, in degrees. The red squares mean that, at those tested orientations, there was 0.6 to 0.7 degrees of error. The large areas of blue mean the algorithm was within 0.1 to 0.2 degrees of error. The mean error over all tested poses were 0.037 and 0.045 degrees, respectively. Not bad for single-frame estimates.

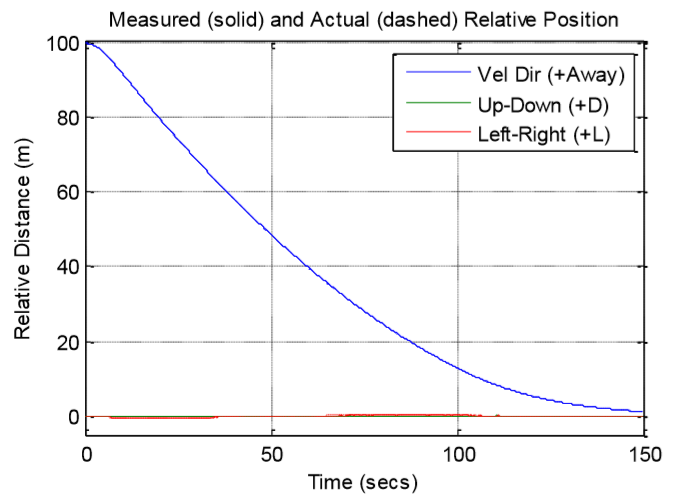
This next image shows what happened when we compared an approach from 100 meters out to the docking adapter using truth and estimated values. Honestly, this wasn’t a great plot since the two overlay so well that you can’t tell the difference at this scale.
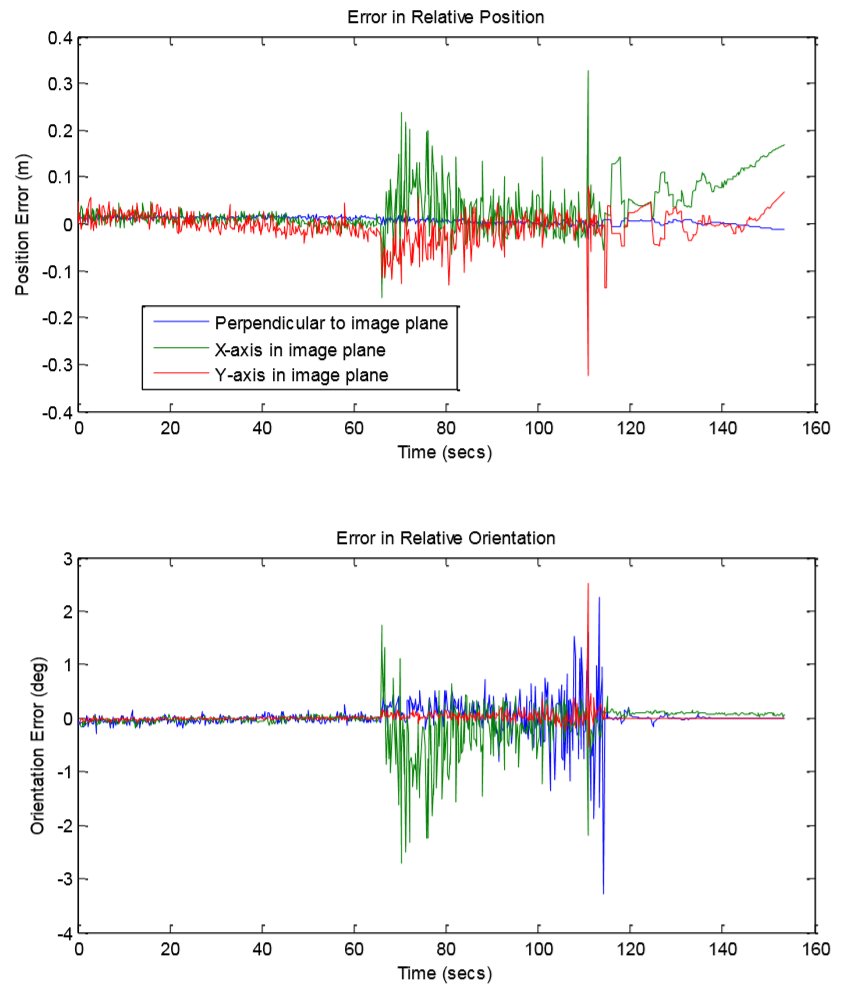
More interesting are the fine-scale position and orientation errors. You can see that there’s a range where things get noisy (but still acceptable for the mission requirements.) The first issue is that the docking ring has strong 120-degree symmetry. In other words, the docking ring looks close to the same every time you rotate through a third of a circle. If you don’t factor in things like physics (which says you’re not likely to twist that much between frames) you can get tripped up on the small differences between sections. The second issue is that we were looking for the docking cross, which is a kind of lighthouse that’s easy for human eyes to pick out and navigate relative too. However, it was barely showing up in lidar due to its relatively small size and the way it reflects light away from the detector.
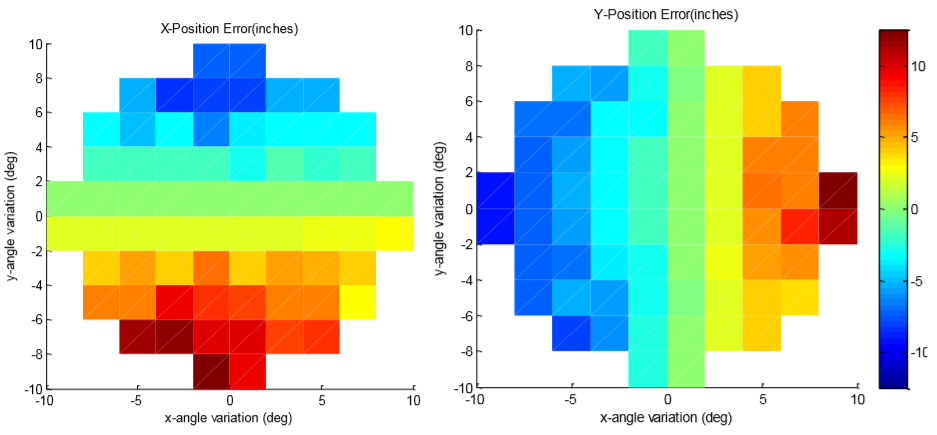
I reworked my algorithms to stop looking for the cross and instead look at everything around the cross. This ended up working much better, as shown in the image below. These plots are like the plots above, where the x and y axes represent the true pose of the camera relative to the target and the color bar says how wrong the algorithms are, in inches. You can see that even a ten-degree angle (which is not plausible this close to the station) resulted in ten inches or less of positional error, while nominal angles were within an inch or two of the truth.
And, although we did not publish a paper on follow-on work, I can say that we continued working on this and we improved significantly from this point. I bet I virtually docked with the space station over five hundred times.
Publication
You can find a copy of the paper here: Docking Paper
Final Thoughts
I’ve worked a lot of machine vision tasks and had a good time. It’s unfortunate that I don’t have too much evidence, though, due to intellectual property protections. For what it’s worth, I’ve worked with the Robot Operating System, OpenCV, the Point Cloud Library, and written many unique algorithms. And I've virtually landed on the moon, docked with Hubble, mapped and grappled asteroids, and much more. Hopefully this single paper sheds some insight into this part of my career.